


Overview
The Storm Center 5 map now includes several new features based on feedback received from our utility clients.
The new release includes enhancements in the functionality for Alert Banner messages as well as three optional new features and configuration options that can be enabled for the current map design.
New Features
Allow Alert Banner messages to include tables and videos.
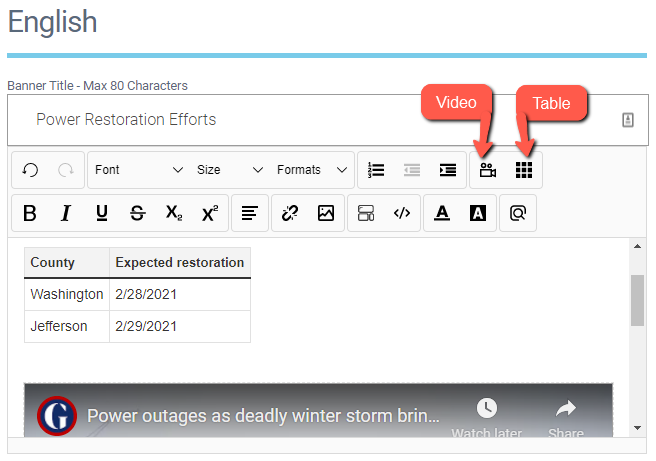
Building on the added capabilities and flexibility for alert banners included in the new map layout released earlier this year, alert banner messages now can include tabular data in the form of table layouts and embedded videos from YouTube or Vimeo. These new options are available for alert banner messages in all supported languages.
We have heard from some clients that they want to use tables to present summarized information such as restoration progress in different areas of their service territory. For utilities who create videos to show the work their crews do in the field or to educate customers about safety, the Storm Center alert banner message now provides another way to share those videos.
The table and video format options are now available to all authorized users in the Control Center Alert Banner app.
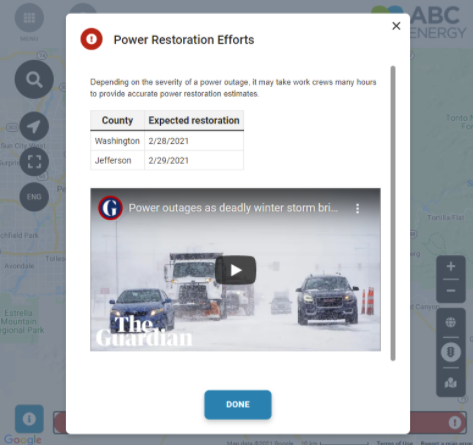
The tables and embedded videos show up in the alert banner message on the Storm Center map as shown below:
Export reports of Outages by Area in CSV format.
Some of our clients let us know that it would be useful to be able to export the current outage summary reports data for counties, municipalities, etc. in a standard tabular format, so these reports could be easily distributed to internal and external stakeholders, as well as any regulatory authorities that need this critical information.
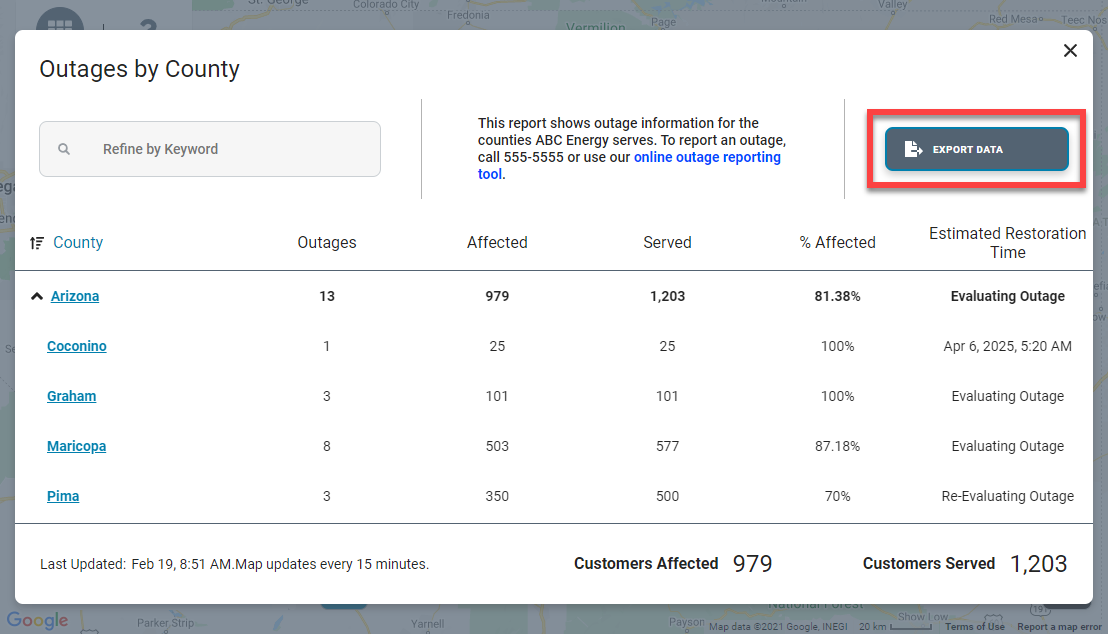
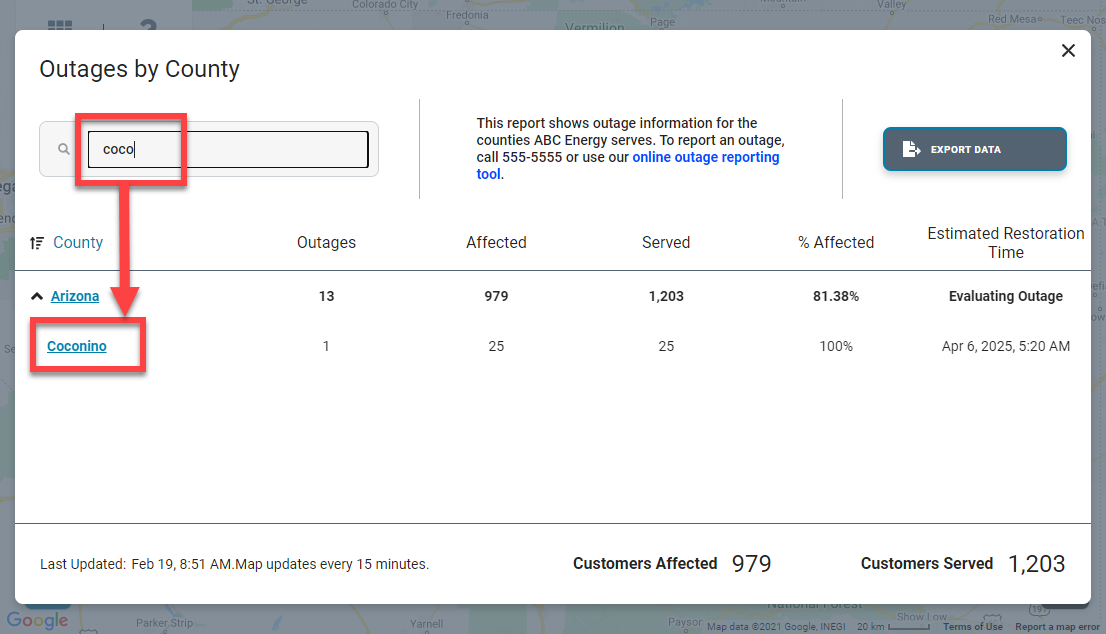
To support this need, Storm Center now includes an optional configuration for each summary report to show or hide a button to export the report data as a CSV file. This new configuration option is disabled by default. To show the Export Data button on a report, you can contact KUBRA and request for this configuration to be enabled.
Summary report data can be exported from either desktop or mobile devices
Export Data Button on Desktop Layout
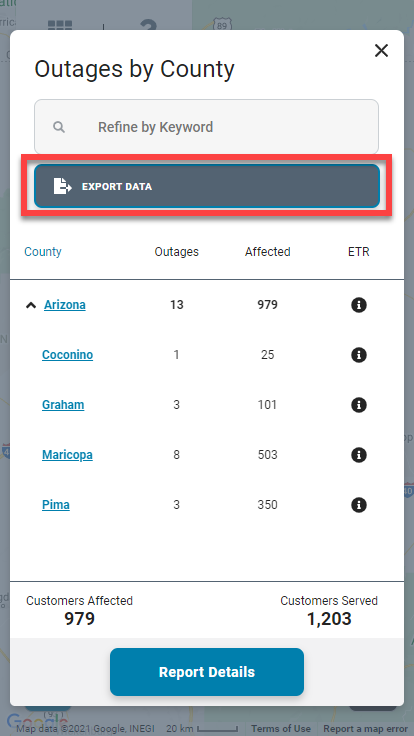
Export Data Button on Mobile Layout
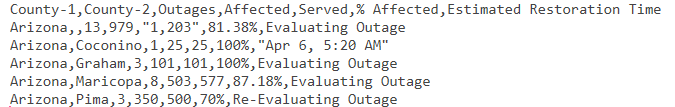
CSV File as Exported
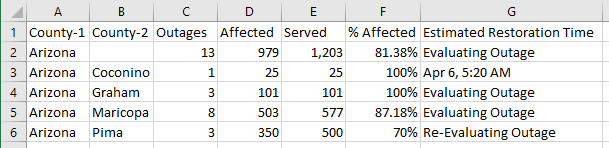
CSV File Opened in Microsoft Excel
If a filter or a sort has been applied to the report when the user clicks the Export Data button, the exported CSV file will include the same filtered information in the same order as it appears on the report at that moment. The report data will be exported in the language that the user has selected on the Storm Center map.
The name of the CSV file will include the type of the report and the date-time of the Last Updated field.
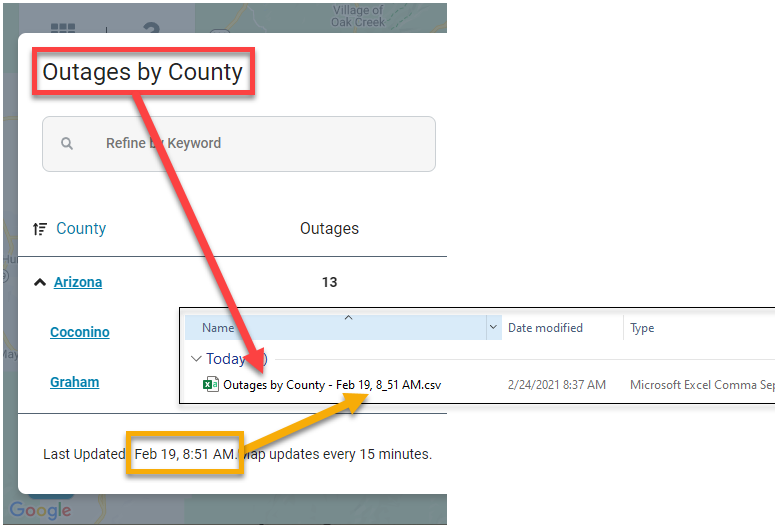
In this example, the file name is the title of the report, “Outages by County,” followed by the date and time from the report footer, “Feb 19, 8_51 AM.”
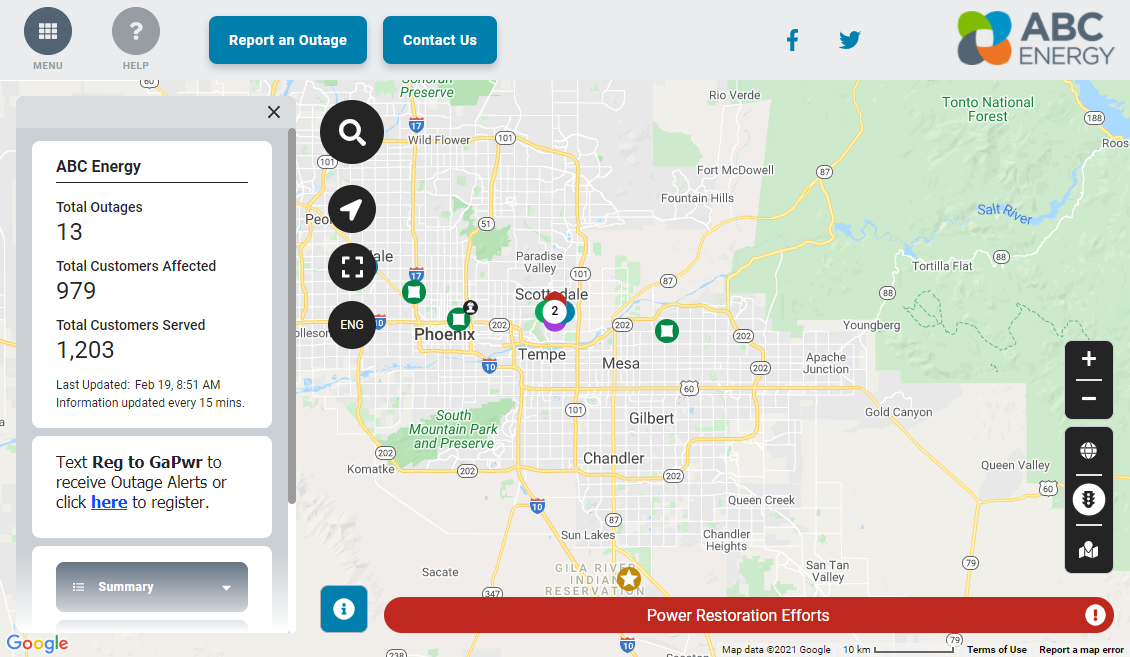
Map legend configuration option for card open or closed on page load.
After the release of the new map design in January 2021 some of our clients let us know that the legend was always open by default on page load for the desktop layout, and for smaller desktop screens when the Overview Panel was also open on page load, a big part of the map was covered.
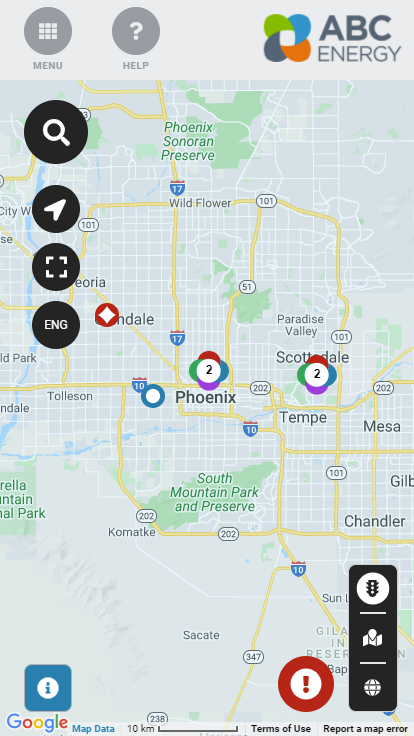
To improve the user experience for our new map design, we have added a configuration option to have the map legend card open or closed on page load. The setting for desktop and mobile layouts can be configured separately. By default, the map legend card will behave as it does today: the map legend will be open on page load for desktop layout and closed on page load for mobile layout.
To adjust the configuration for the map legend card for your Storm Center maps, you can contact KUBRA.
Desktop - Map Legend Card Closed and Overview Panel Open
Mobile - Map Legend Card Closed on Page Load
Additional configuration options for how map view choices appear in the map legends.
Until now, the Storm Center map only allowed one type of map view selector, where all the available map layers (Current Outage Locations, Thematics, Planned Outages, etc.) needed to be part of that selector. Below is an example of the single map view selector.
To support requests from utilities intending to show two different types of data on one Storm Center map, we have added configuration options to support showing map view choices using a combination of radio buttons and a drop-down list. Existing map configurations will not change with the release of this option. If you want to change the layout of your map view choices, you can contact your KUBRA Client Success Manager and request for this new configuration to be enabled.
The main use case for the new configuration options is for showing data about Active Outages and Planned Outages. For example, we can create one map view choice called “Active Outages” and associate to it all the map layers related to active outage information (Outage Locations and all Thematic layers), and a second map view choice called “Planned Outages” and associate to it the Planned Outages Locations layer. An example of the relationship between map view choices and data layers is shown in the table below.
Thematic by Counties
Thematic by ZIP Codes
Thematic by Municipalities
The labels for the new map view choices as well as for the map layer visibility options are configurable for each client.
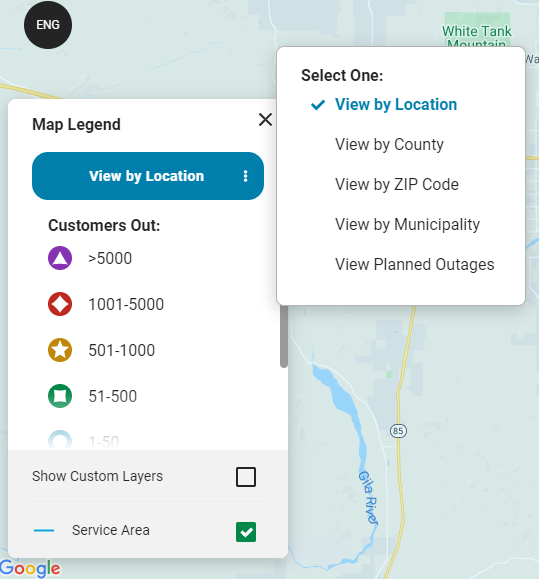
Map view choices can be displayed in the map legend in two possible formats:
- As a list of radio button options directly on the map legend card:
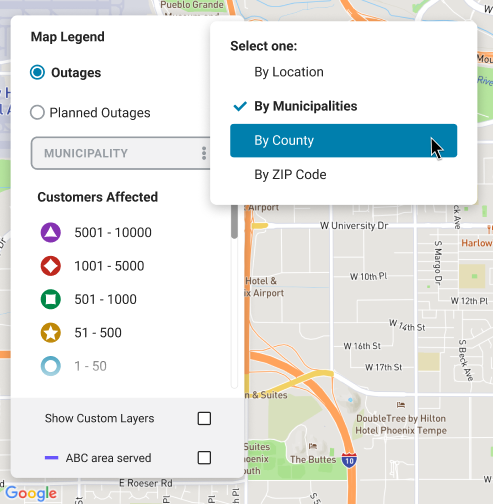
- As a list of radio button options inside the map view selector on the map legend card:
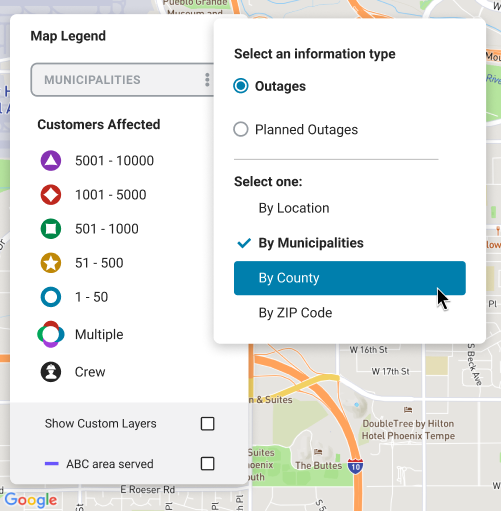
The icons displayed on the map legend will change according to the map view choice and layer visibility option selected.
Another new feature related to map view choices and visibility options is the possibility to select a map view choice and visibility option on page load using URL parameters (specifically the parameters c and o).
For example, if you want to include a direct link on your website to open a Storm Center map with the Planned Outages map view choice selected, you can use a link like:

If you want to share a link to a Storm Center map with a specific layer visibility option selected, like the County thematic layer, you can use a link like:

The values of the URL parameters will depend on the implementation.
For more information about all the URL parameters supported by Storm Center, please see the URL Parameters online documentation.
Release Details
- Production Date: The new features were released on March 22, 2021, and are available for all Storm Center 5 clients.
- Type: Automatic - This update will not disrupt any current implementations. Existing configurations will be maintained.
-
Notes:
- This update will not affect any items configured for Storm Center maps or managed in the Alert Banner app.
- You can include tables and videos in alert banner messages starting the day of the release.
- To start using any of the other new features that are part of the release (export reports to CSV, legend open or closed on page load, and map view options), contact your KUBRA Client Success Manager to discuss any needed configuration changes.