


Overview
Thank you for your support and feedback over the last year. We have built several new features into the product with this feedback in mind. You can now view the percentage of customers with power on your map which will be useful in determining the severity of an ongoing event affecting your customers’ service area.
You will also benefit from greater flexibility when it comes to sharing outage data with your customers. We have developed new configuration tools for the Implementation team to use during the outage layer configuration process. You can now request the use of non-default icons that follow certain specifications to present outages on the map.
Field ‘Percentage of Customers With Power’ for utility’s service territory in Summary Totals
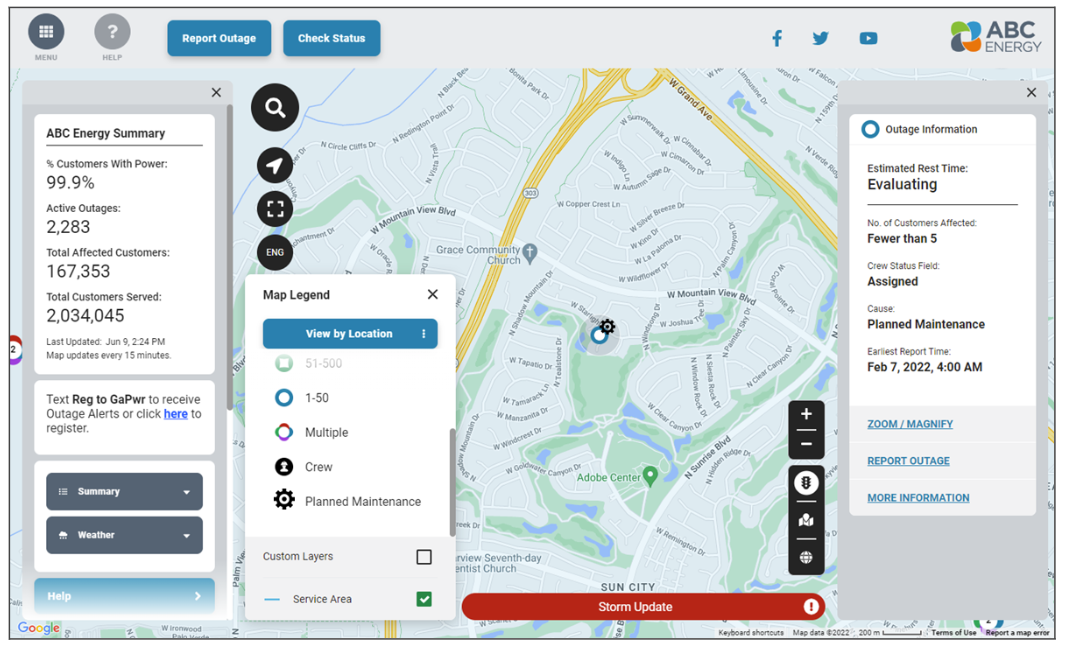
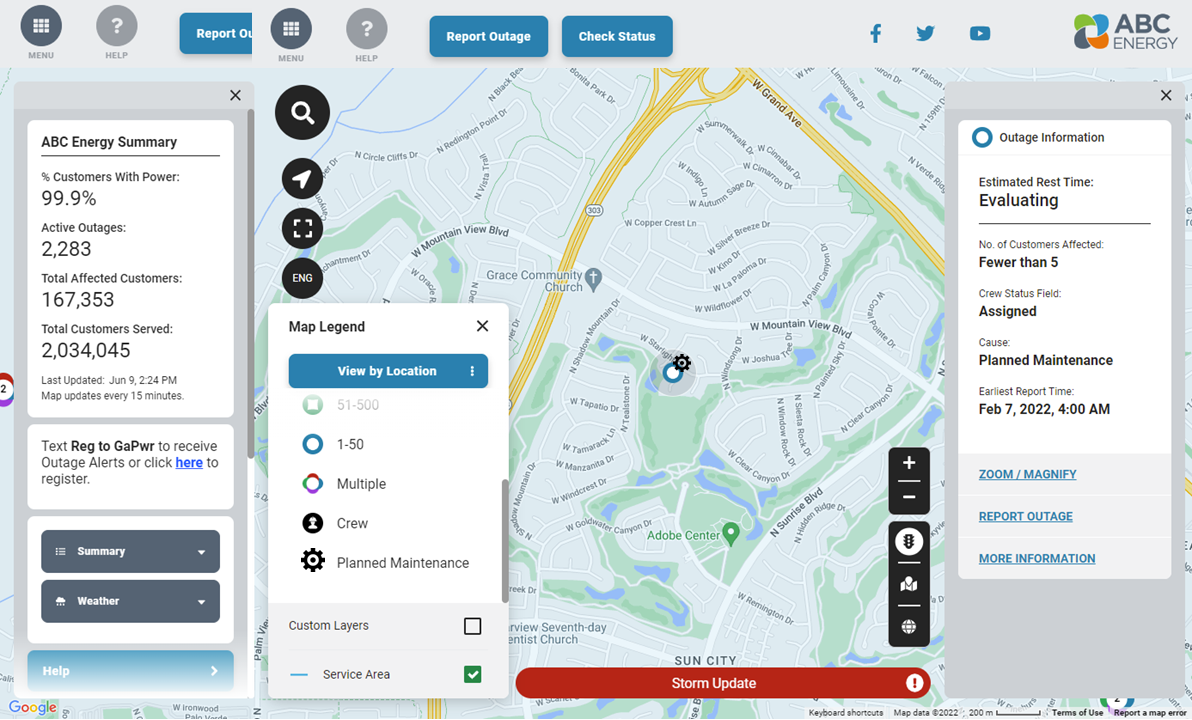
The Storm Center map gives you the option of including the field Percentage of Customers with Power in the utility service territory. This information is shown in the Overview panel at the top of the Summary Totals section.
It is a great metric to communicate the current reliability of the electric network to your customers, especially during a significant weather event affecting the utility’s service area.
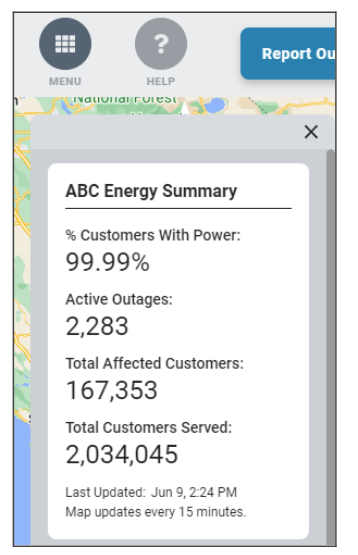
The field can be presented in one of two ways:
- As a percentage of customers WITH power
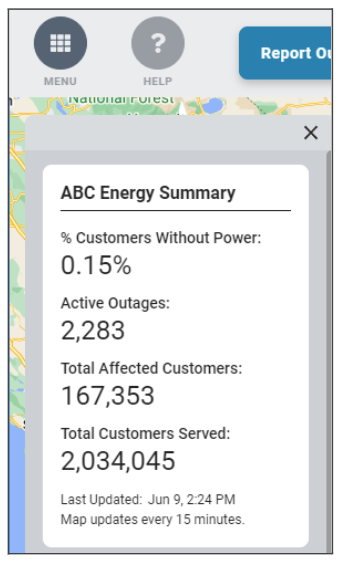
- As a percentage of customers WITHOUT power
It is also possible to configure the precision of the displayed result. The maximum precision allowed is two decimal places.
Ability to use client-provided custom map icons for active outages layer and planned outages layer
Until now, the only icons that could be used to present active outages and planned outages on the Storm Center map were the ADA-compliant icons provided as part of the product. In order to add more flexibility and brand control, you can now use custom icons.
In order to manage these new icons, KUBRA enhanced our configuration process so you can provide custom icons to our Implementation team during the implementation phase of a project. These icons can then be used for active outage and planned outage layers instead of the product default icons. However, you still have the option to use the product’s recommended map icons..
The supported image file types are JPEG, GIF, PNG, and SVG (recommended). The maximum file size allowed per image is 1 MB.
KUBRA recommends using the following image sizes (in pixels): 24x24 to 32x32 for individual outages and 40x40 for outage clusters. For these custom icons, we also recommend using a combination of color and shape to help users with color vision deficiencies.
Ability to use different map icons based on outage properties for active outages and planned outages
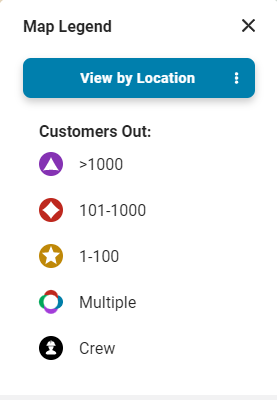
Up to now, the icon to show an outage on the map (active outage or planned outage) was determined exclusively by the number of customers affected by the outage and if there was a crew present/assigned or not (as shown below).
However, we understand there are alternative use cases where you may want to present additional information graphically through the outage icon in a way that is intuitive to the end-user.
For example, if an active current outage was caused by planned maintenance, it could be useful to present that outage on the map with a different symbol. This could save the end-user extra steps because it wouldn’t be necessary to click the icon to access the outage information to know it is caused by maintenance work.
For this, KUBRA developed new configuration tools that allow our Implementation team to define how to present outages on the map using different icons based on the value of a certain field (or combination of them) provided in the outage file. The supported field types are integer, string, and boolean. This tool also supports mapped fields like Cause, Crew Status, and properties within the Metadata field, among others.
Note: Although this new feature is very versatile and allows deep configuration capabilities, it should be used for relevant use cases only. If overused, the map may become cluttered with icons, making it difficult for the customer to understand. The legend would also become too complex to decipher.
Ability to show labels within current outage and planned outage icons on the map.
For the active outages layer and the planned outages layer, our Implementation team can now configure the outage icons to include certain labels for the map icon:
- For individual outage icons - Number of customers affected (NEW feature).
- For outage cluster icons - Total number of customers affected (NEW feature) and number of outages in the cluster (supported today but was limited to “50+”).
It is also possible to mask numbers above a certain threshold (e.g. use the label “99+” for outages with 100 or more customers affected).

Individual outage icon with label indicating 11 customers affected

Outage cluster icon with label indicating 100 or more customers affected
Note: In order to make a label fit within an icon and improve readability, a custom icon with a different design for the label might be needed.
Custom images for social media icon buttons.
Storm Center’s layout allows us to include icon buttons linked to your social media channels. The social media links are shown on the map header (for classic layout on desktop) or in the Overview panel (for classic layout on mobile and for flex layout).

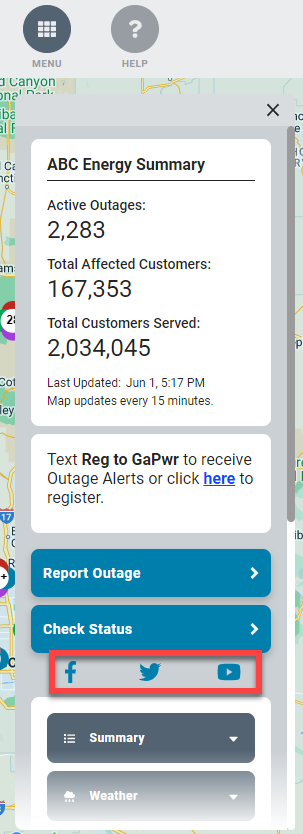
Prior to this update, social media icon buttons were supported for Facebook, Instagram, Twitter, and YouTube.
However, we understand that clients may occasionally like to promote social media channels or other applications not on this list or use images that are more aligned with the branding they already use on their website.
Our Implementation team can now configure social media links to use custom images provided by you. They can also include links to other applications like our IncidentWatch map.

The supported image file types are JPEG, GIF, PNG, and SVG (recommended). The maximum file size allowed per image is 1 MB. KUBRA also recommends using image sizes of 22x22 pixels; otherwise the image will be scaled down to fit that space constraint.
Release Details
Production Date: The new features are available for all Storm Center 5 clients starting June 21, 2022.
Type: Automatic - This update will not disrupt any current implementations. Existing configurations will be maintained.
Notes:
- This update will not affect any items configured for Storm Center maps.
- To start using any of the other new features that are part of the release, contact your KUBRA Client Success Manager to discuss any needed configuration changes.